


Earlier today, we open-source ee-outliers, our in-house developed framework to detect outliers in events stored in Elasticsearch. This blog post is the first of several in which we want to dive a bit deeper in how we use ee-outliers ourselves in our own security monitoring activities.
Today we will look at how ee-outliers can be used to detect beaconing TLS connections in security events stored in Elasticsearch. Beaconing connections are connections that occur with regular intervals, and which could indicate that a computer is infected and “phoning home” – for example to get instructions from the Command & Control server, or to silently exfiltrate data from the network.
Let’s get started!
Preparing ee-outliers
As this is the first post in the series, we will describe in a bit more detail how we can get started with the setup of ee-outliers; as the framework runs entirely on Docker, the requirements are close to zero. The only requirement is Docker and connectivity to an Elasticsearch cluster, containing your data.
The “getting started” section in the README on GitHub has all the details needed to get started. In the next section we will focus on creating the configuration file and the use case section specifically for TLS beaconing detection.
Creating the configuration file
We start from the default ee-outliers configuration file from the GitHub repository. It contains all the sections & configuration options we need. Modify the parameters in the “general” section at the top to ensure ee-outliers can connect to your Elasticsearch cluster.
We can leave all the default values as they are defined, including beaconing_batch_eval_size.
[beaconing]
# Define how many events should be processed at the same time, before looking for outliers.
# More often means better results, but will result in increased memory usage.
beaconing_batch_eval_size=1000000
By setting print_outliers_to_console to 1, we are also able to directly see the detected outliers on the command line output. Very handy for debugging!
print_outliers_to_console=1
There is 1 specific configuration setting we need to tweak though: we need to tell ee-outliers which is the timestamp field, and provide a grok pattern to convert it into a split in days, hours, minutes, etc. This is done as following in our example, where the timestamp field for the events is simply called “timestamp”. The below derived field will make new fields available in our use cases, including the “timestamp_day” and “timestamp_hour” fields, which we will both need.
##############################
# DERIVED FIELDS
##############################
[derivedfields]
timestamp=%{YEAR:timestamp_year}-%{MONTHNUM:timestamp_month}-%{MONTHDAY:timestamp_day}[T ]%{HOUR:timestamp_hour}:?%{MINUTE:timestamp_minute}(?::?%{SECOND:timestamp_second})?%{ISO8601_TIMEZONE:timestamp_timezone}?
Next, we create the a new configuration section that will be used to define the statistical TLS beaconing detection model. This use case is already defined in the example configuration file and looks as following:
##############################
# BEACONING - DETECT OUTBOUND SSL BEACONING - TLS
##############################
[beaconing_ssl_outbound]
es_query_filter=BroFilter.event_type:"ssl.log" AND _exists_:BroFilter.server_name

aggregator=BroFilter.server_name,BroFilter.id_orig_h,timestamp_day
target=timestamp_hour
trigger_sensitivity=1

outlier_type=suspicious connection
outlier_reason=beaconing TLS connection
outlier_summary=beaconing TLS connection to {BroFilter.server_name}

run_model=1
test_model=0
Taking apart the use case line by line:
[beaconing_ssl_outbound]
The section between square brackets specifies the name of the model to run. By starting the model name with “beaconing_”, ee-outliers will know to apply the statistical beaconing detection model for this use case.
es_query_filter=BroFilter.event_type:"ssl.log" AND _exists_:BroFilter.server_name
The es_query_filter parameter specifies the Elasticsearch query the model should use in order to collect its events to analyze. In our specific case, we select all the Bro events from the ssl.log file stored in our cluster. In addition, we only select all SSL events that also create a server name field, as we will use this field later in the aggregator.
aggregator=BroFilter.server_name,BroFilter.id_orig_h,timestamp_day
target=timestamp_hour
trigger_sensitivity=1
The model will then count all unique instances of the target field, for each individual aggregator field. In this specific case, this means that ee-outliers will create “buckets” for each hour of the day (timestamp_hour – one of the derived fields we created earlier) and fill these buckets for each unique combination of the aggregator.
As an example: let’s say that there are events for TLS connections in the cluster to the domain “sneaky.com” that appear about 5 each hour, for a specific source IP (192.168.0.2) for a specific day (19/12). ee-outliers will then create the following buckets in order to spot outliers:
Aggregator: "sneaky.com - 192.168.0.2 - 19/12"
Target: 00 (midnight)
Total count: 5

Aggregator: "sneaky.com - 192.168.0.2 - 19/12"
Target: 01 (01:00 AM)
Total count: 4

Aggregator: "sneaky.com - 192.168.0.2 - 19/12"
Target: 02 (02:00 AM)
Total count: 5
...
These buckets will be created for ALL combinations possible for the aggregator. In this case, for all combinations of unique server names, source IPs and days in the range of the events processed by ee-outliers.
trigger_sensitivity=1
The trigger sensitivity finally defines how many “standard deviations” tolerance we allow in order to still consider something beaconing. In our example above, our bucket for 01:00 AM only has 4 requests instead of 5. Without some tolerance, these would thus not be spotted as being outliers! By defining the trigger sensitivity and setting it to 1 (or higher for more tolerance), we allow for small changes in the bucket counts to still be considered outliers. For example, the following 24 count values (1 for each hour of the day) would still be flagged as beaconing with a trigger_sensitivity set to 1:
5 5 5 4 4 5 5 5 5 3 5 5 5 2 5 5 5 5 4 5 5 5 5 5
In the above example, the standard deviation is 0.74; as it’s smaller than 1, all the events beloning to these 24 buckets will be flagged as outliers.
Small additional detail: the “beaconing” model has a built-in requirement where at least 10 buckets should be available; otherwise, no beaconing will be detected (in other words: if the series above only had 9 values instead of 24 or the minimum of 10, it would not be flagged as outliers).
We then specify the outlier type, reason and summary. Notice that the summary can contain placeholder fields! These fields will all be enriched in outlier events, and will make it much easier for the analyst to visualise them later on.
outlier_type=suspicious connection
outlier_reason=beaconing TLS connection
outlier_summary=beaconing TLS connection to {BroFilter.server_name}
Last but not least, we tell ee-outliers to run the model. The run and test flags can be globally enabled or disabled in the “general” section of the configuration file. This way, it’s easy to quickly enable or disable a range of use cases (for example, enable all “test” use cases during development):
run_model=1
test_model=0
Running ee-outliers
With the model configured, it’s time to run ee-outliers and see the results. To do this, we build ee-outliers and run it as defined in the README file on GitHub. In this case, we will run in interactive mode so we immediately see the results on the command line output. You might have to specify a specific Docker network for this when running ee-outliers from where Elasticsearch is reachable, as explained in the README (called “sensor_network” in our example below).
# Build the image
docker build -t "outliers-dev" .

# Run the image
docker run --network=sensor_network -v "$PWD/defaults:/mappedvolumes/config" -i outliers-dev:latest python3 outliers.py interactive --config /mappedvolumes/config/outliers.conf
Looking at the output of ee-outliers, we notice that it has discovered some TLS events that appear to show beaconing behavior:
2018-12-11 23:32:02 - INFO - ===== evaluating ssl_outbound outlier detection =====
2018-12-11 23:32:02 - INFO - analyzing 6,001 events
2018-12-11 23:32:05 - INFO - ssl_outbound - evaluating beaconing model [100.00% done]
2018-12-11 23:32:05 - INFO - evaluating batch of 6,001 terms
2018-12-11 23:32:05 - INFO - outlier - beaconing TLS connection to rules.emergingthreatspro.com
2018-12-11 23:32:05 - INFO - outlier - beaconing TLS connection to rules.emergingthreatspro.com
2018-12-11 23:32:05 - INFO - outlier - beaconing TLS connection to rules.emergingthreatspro.com
2018-12-11 23:32:05 - INFO - outlier - beaconing TLS connection to rules.emergingthreatspro.com
2018-12-11 23:32:05 - INFO - outlier - beaconing TLS connection to rules.emergingthreatspro.com
2018-12-11 23:32:05 - INFO - outlier - beaconing TLS connection to rules.emergingthreatspro.com
2018-12-11 23:32:05 - INFO - outlier - beaconing TLS connection to rules.emergingthreatspro.com
In case we enabled the “es_save_results” flag in the configuration file, these events will now be tagged with new outlier fields, which can be visualised and reviewed; that’s what we will do next!
Visualising the results
In our case, we will use Kibana to visualise the newly tagged outlier events. We create a histogram on all events that contain the “outliers.reason” field. In our example, we also created two tables that show the outlier types and reasons, so the analyst can quickly filter on the ones of interest:
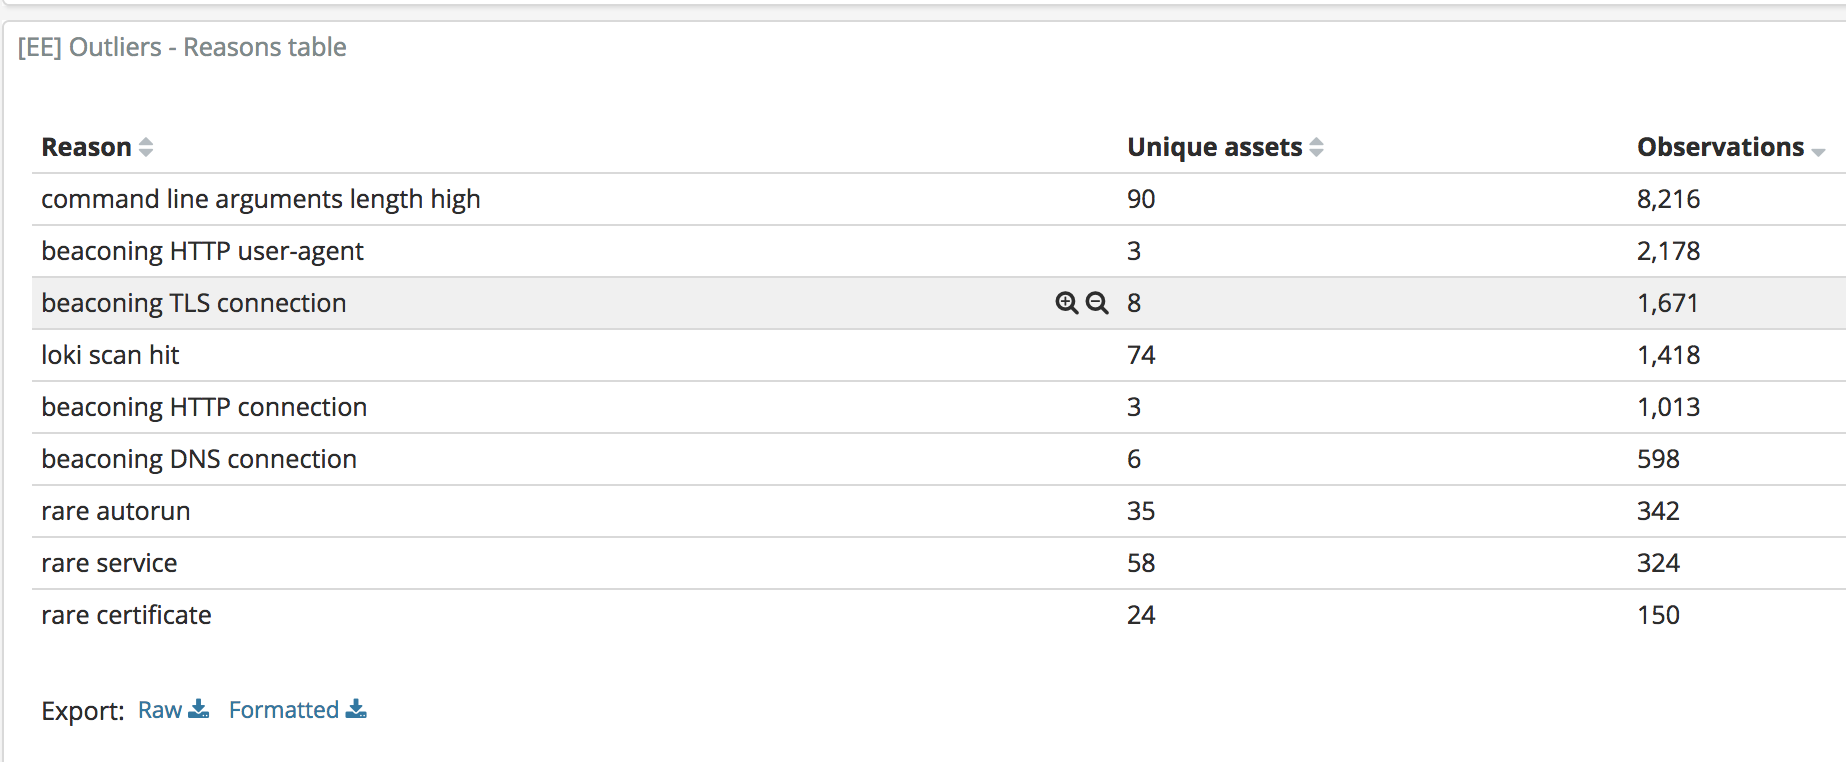
We then filter on the “beaconing TLS connection” one (this is the name of the “outlier_reason” field we defined in the use case). Next, we created a table that is able to filter on the “outlier_summary” field:

In our example, we decided to deep-dive on the second hit in the list. By filtering on this one (rules.emergingthreatspro.com), we can see the following resulting histogram:

That certainly looks like beaconing behaviour! In fact, it’s one of our lab machines that is periodically pulling new IDS rules from the Emerging Threats website.
By checking the aggregator values, we can see which aggregator buckets ee-outliers calculated (format: server_name – IP – hour of day, exactly as we defined in the use case):

Finally, by zooming in on the “terms” field, we can see how many requests were made per hour. Notice that ee-outliers will do this analysis for each day (as timestamp_day is part of the aggregator field we configured):

Conclusion
In this blog post, we illustrated the power of the beaconing model in ee-outliers in order to detect beaconing behaviour for combinations of arbitrary fields stored in Elasticsearch. The beaconing model can be used for much more: detect automated Windows logons, detecting HTTP and DNS beaconing, etc. Using the trigger sensitivity, we can decide to make the model either more or less strict in detecting outliers, giving the analyst powerful tools to tweak and tailor each defined use case to their needs. Finally, by enriching each outlier event with new fields, dashboarding the outliers in your favorite front-end (Kibana in our screenshots) becomes trivial.
Any comments or feedback is welcome, and we will be doing more write-ups on other detection use cases in ee-outliers soon!
About the author
 Daan Raman is in charge of NVISO Labs, the research arm of NVISO. Together with the team, he drives initiatives around innovation to ensure we stay on top of our game; innovating the things we do, the technology we use and the way we work form an essential part of this. Daan doesn’t like to write about himself in third-person. You can contact him at draman@nviso.be or find Daan online on Twitter and LinkedIn.
5 thoughts on “TLS beaconing detection using ee-outliers and Elasticsearch”
Comments are closed.