
This is the first post in a series of write-ups on some of the challenges that were tackled by students during our Cyber Security Challenge Belgium this month.
Credits
All challenges of the Cyber Security Challenge Belgium are created by security professionals from many different organisations. The TraceMe challenge in particular was created by Vasileios Friligkos, one of our distinguished challenge contributors.
The challenge
At your day job, per your recommendation and after many requests, you recently activated host based monitoring using Sysmon.
Perfect! You are now going to have a visibility on each host of your IT system giving you perfect awareness and detection capabilities that will be able to thwart even the most persistent attackers…
Before you can finish your thoughts, you get interrupted by a phone call:
“Steve”, (yes, this is you) says an irritated voice on the other side of the line.
– “Yes…”, replies Steve (yep, still you).
“Your awesome monitoring system did not work, we got an infection.”
– “But there are no detection rules implemented yet, it’s normal that we didn’t… “, you start explaining when you get interrupted.
“At least, tell me you can identify how the infection occurred!”
Eh, yes sure I can…And by that, the irritated voice (who by the way is your boss) hangs up and sends you one file with the Sysmon log data of the infected host.
Can you identify the benign (non malicious) process that was abused and was ultimately responsible for the infection?
Can you also identify the IP from where the second stage was downloaded (the first connection made by the malware)?If so, you will be able to save your reputation and also get the points for this challenge by submitting the SHA1 of the abused, benign process (Uppercase) + the IP where the second stage is hosted.
Good luck Steve!
The solution
Evtx is the Windows event file format which makes sense since Sysmon writes to the “Applications and Services Logs/Microsoft/Windows/Sysmon/Operational” event folder as indicated here: https://technet.microsoft.com/en-us/sysinternals/sysmon
There are many ways to start interacting with these events, there is even an official Windows log parser that can query event log data.
If we go this way, we have to download the LogParser and run the following command to extract all logs in csv format:
$> LogParser.exe -i:EVT -o:csv "SELECT * from sysmon.evtx" > sysmon.csv
This gives us a .csv file with 3.021 log lines of different sizes and types.
By checking the description of Sysmon on the MS site we see that the following types of events can be logged:
- Event ID 1: Process creation
- Event ID 2: A process changed a file creation time
- Event ID 3: Network connection
- Event ID 4: Sysmon service state changed
- Event ID 5: Process terminated
- Event ID 6: Driver loaded
- Event ID 7: Image loaded
- Event ID 8: CreateRemoteThread
- Event ID 9: RawAccessRead
- Event ID 10: ProcessAccess
- Event ID 11: FileCreate
- Event ID 12: RegistryEvent (Object create and delete)
- Event ID 13: RegistryEvent (Value Set)
- Event ID 14: RegistryEvent (Key and Value Rename)
- Event ID 15: FileCreateStreamHash
- Event ID 255: Error
Ok, many interesting events that we could use. In the file, we see that we have events of the following types 1, 2, 3, 5 and 6.
Since we do not have any initial information to start investigating and then pivot until the initial infection, we need to search for abnormal or at least unusual behaviour.
For example, we see that we have only one event ID 6 but by investigating the name of the driver and its SHA we realise that it concerns a legitimate driver.
Since there are not so many logs, we could use excel to try and make some sense by colouring for example the log lines based on the event id.

If we zoom out and simply scroll over the logs, we see that there is a very important network activity at some moment:

By simply investigating, we see that there are many UDP requests to port 6892 by a “roaming.exe” process found in “C:\Users\TestPC\AppData\” and with destination adjacent IPs in the same subnet:

This looks surely suspicious and we could take this lead for our investigation but let’s say that we don’t go this way (Steve doesn’t like excel) and we prefer to put our ninja awk skills into use!
Some parsing is necessary since the comma is a field separator but also found inside the fields and there is much useless information that we can dump.
In this case, let’s choose to substitute the field separator by the pipe ( “|” ) in order to be able to use awk easily, let’s also separate the process creation events (event id 1 – file sysmon_process_creation.csv) and the connections events (event id 3 – file sysmon_connections.csv).
For process creation, we keep the following fields:
EventID|PID|Process|Command|Directory|User|SHA1|PPID|ParentProcess|ParentProcessCommand
Let’s filter the data and search for some unusual execution locations or uncommon process names:
awk -F "|" '{ print "Process:"$3 }' sysmon_process_creation.csv | sort | uniq -c | sort -rn

We see two executables from the %AppData% directory:
- “Roaming.ExE”
- “OneDrive.exe”
We can pull their SHA1’s and check online whether they are legitimate. Doing so does not reveal clearly if any of them is malicious.
If we try to see the parent processes:
- “Roaming.ExE” -> powershell and roaming.exe
- “OneDrive.exe” -> explorer
Hmm, powershell could be something worth investigating, let’s show also the parent process full command:

Ok, this surely looks bad: powershell launched a hidden download of an executable which was also executed at the end of the command.
So, at last, we have our investigation lead: roaming.exe
For information, we could have used the connections log file to help us spot outliers.
By sorting and counting unique occurrences (similar as for process creation logs) of processes and target IPs we do not have a clear result because we have too many chrome.exe processes reaching to multiple IPs
awk -F "|" '{ printf "Process: %-90s DST:%s:%s\n",$3,$13,$15 }' sysmon_connections.csv | sort | uniq -c | sort -rn

But if we ignore the destination IP and focus only on the destination port, then we should have a clearer view:
awk -F "|" '{ printf "Process: %-90s DST_Port:%s\n",$3,$15 }' sysmon_connections.csv | sort | uniq -c | sort -rn
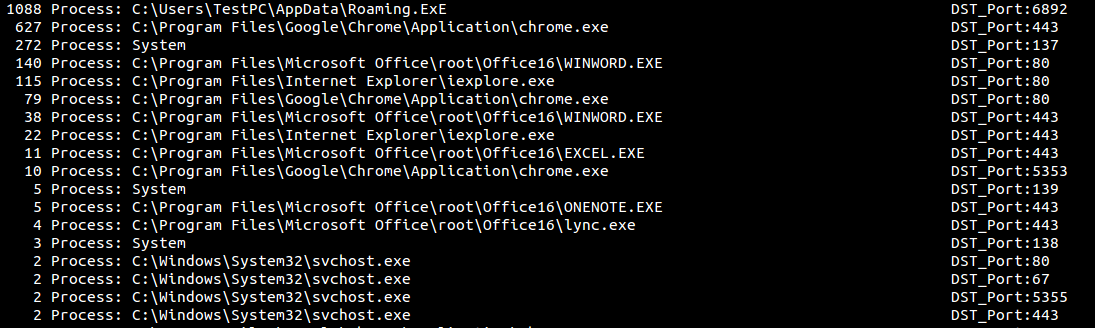
Roaming.exe communicated 1.088 times over port 6892 (on UDP) which when looking online directly leads to Cerber malware.
In both cases, we have roaming.exe which looks malicious and by following its parent process PID we can trace the activities and the initial infection:
- Roaming.exe PID: 1868 was created by powershell.exe PID: 2076
- Powershell.exe PID: 2096 was created by cmd.exe PID: 2152
(We notice that there are two processes with the same PID: 2152 – “cmd.exe” and “Acrobat Reader DC\Reader\reader_sl.exe”; keep in mind that PID’s can be reused)
- Cmd.exe PID: 2152 was created by winword.exe PID: 2232
The parent of winword.exe is explorer.exe which is legitimate and therefore, we can deduce that winword.exe was abused (probably by a macro) and resulted in executing a cmd.exe command that launched a powershell command to fetch the second stage malware (probably cerber according to OSINT).
Therefore, the first part to the solution is the SHA1 of winword.exe:
- CE3538D04AB531F0526C4C6B1917A7BE6FF59938
For the second part, we need to identify the IP of the site from which the second stage was downloaded.
From the powershell command we know that the URL is: footarepu[.]top but instead of resolving the domain name (since it might have changed since the infection), we can find the IP in the sysmon_connections.csv since we have the PID and process name of all the connections.
Searching for powershell.exe PID: 2076 we find one contacted IP over port 80:
- 35.165.86.173
which is the second part of the solution.
Flag: CE3538D04AB531F0526C4C6B1917A7BE6FF59938_35.165.86.173
Good job Steve!